Easy Framework to always ensure whats in your track-and-trace system is in your real life grow
Written by Ron Johnson on Jun 15, 2021
With Metrc now active in your state, compliance reporting will become a repetitive, on-going task in your operation. Whether this process is simple or a complex nightmare depends on internal processes and systems.
In a well managed grow operation you are repeating the same process over and over again with the exception of some variables like the genetics you’re running. If you’re repeating the same actions over and over, shouldn’t you be able to predict what happens next? Shouldn’t we generally know how many plants should be in any given phase or zone at any given time?
The crux of compliance is keeping what’s in your operation consistent with what’s in your track-and-trace system. It may seem straightforward, but when you get caught in the shuffle of running a grow operation, pheno hunting, managing a team, and moving product it can become a bit more complex.
The goal is to introduce a system where you never get off track with what’s going on in your operation and provide an example of how it works in a real operation. Having a predictive operational process that adheres to compliance requirements with ease comes down to better understanding your operation.
Understanding Plant Cohorts
In doing this you want to have as many fixed actions and inputs as possible. Some examples of what should be fixed in your operation to create more predictability would be;
- Flowering areas / sq ft *ideally flowering rooms are equal size
- Plant counts necessary to maximize the canopy sq ft per flower area
- Destroy rate between phases
Once you have this figured out you can easily back into how many plants should be in any given phase at any given time instantaneously.
Example
Indoor Facility 2500 sq ft
- Flowering Area’s = 2
- Max Plants Per Flower Area = 160
- Destroy Rate By Phase
undefinedundefined
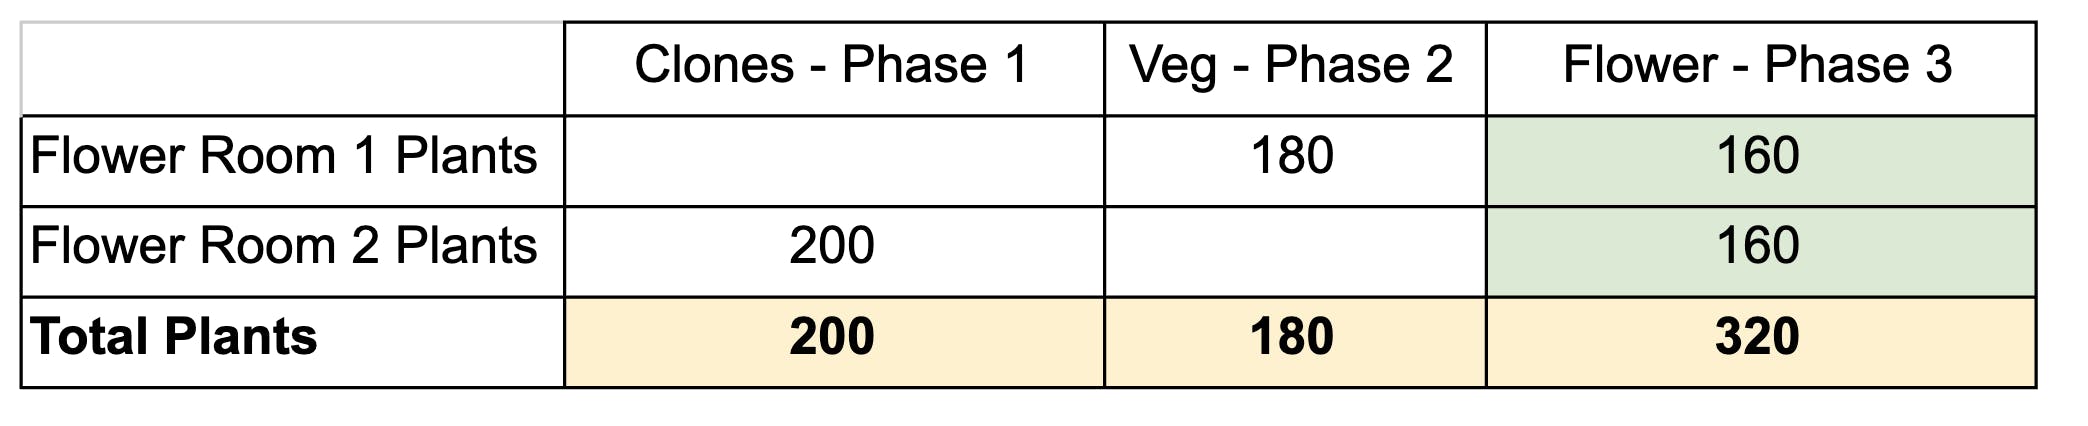
In GroLens this would be represented like this
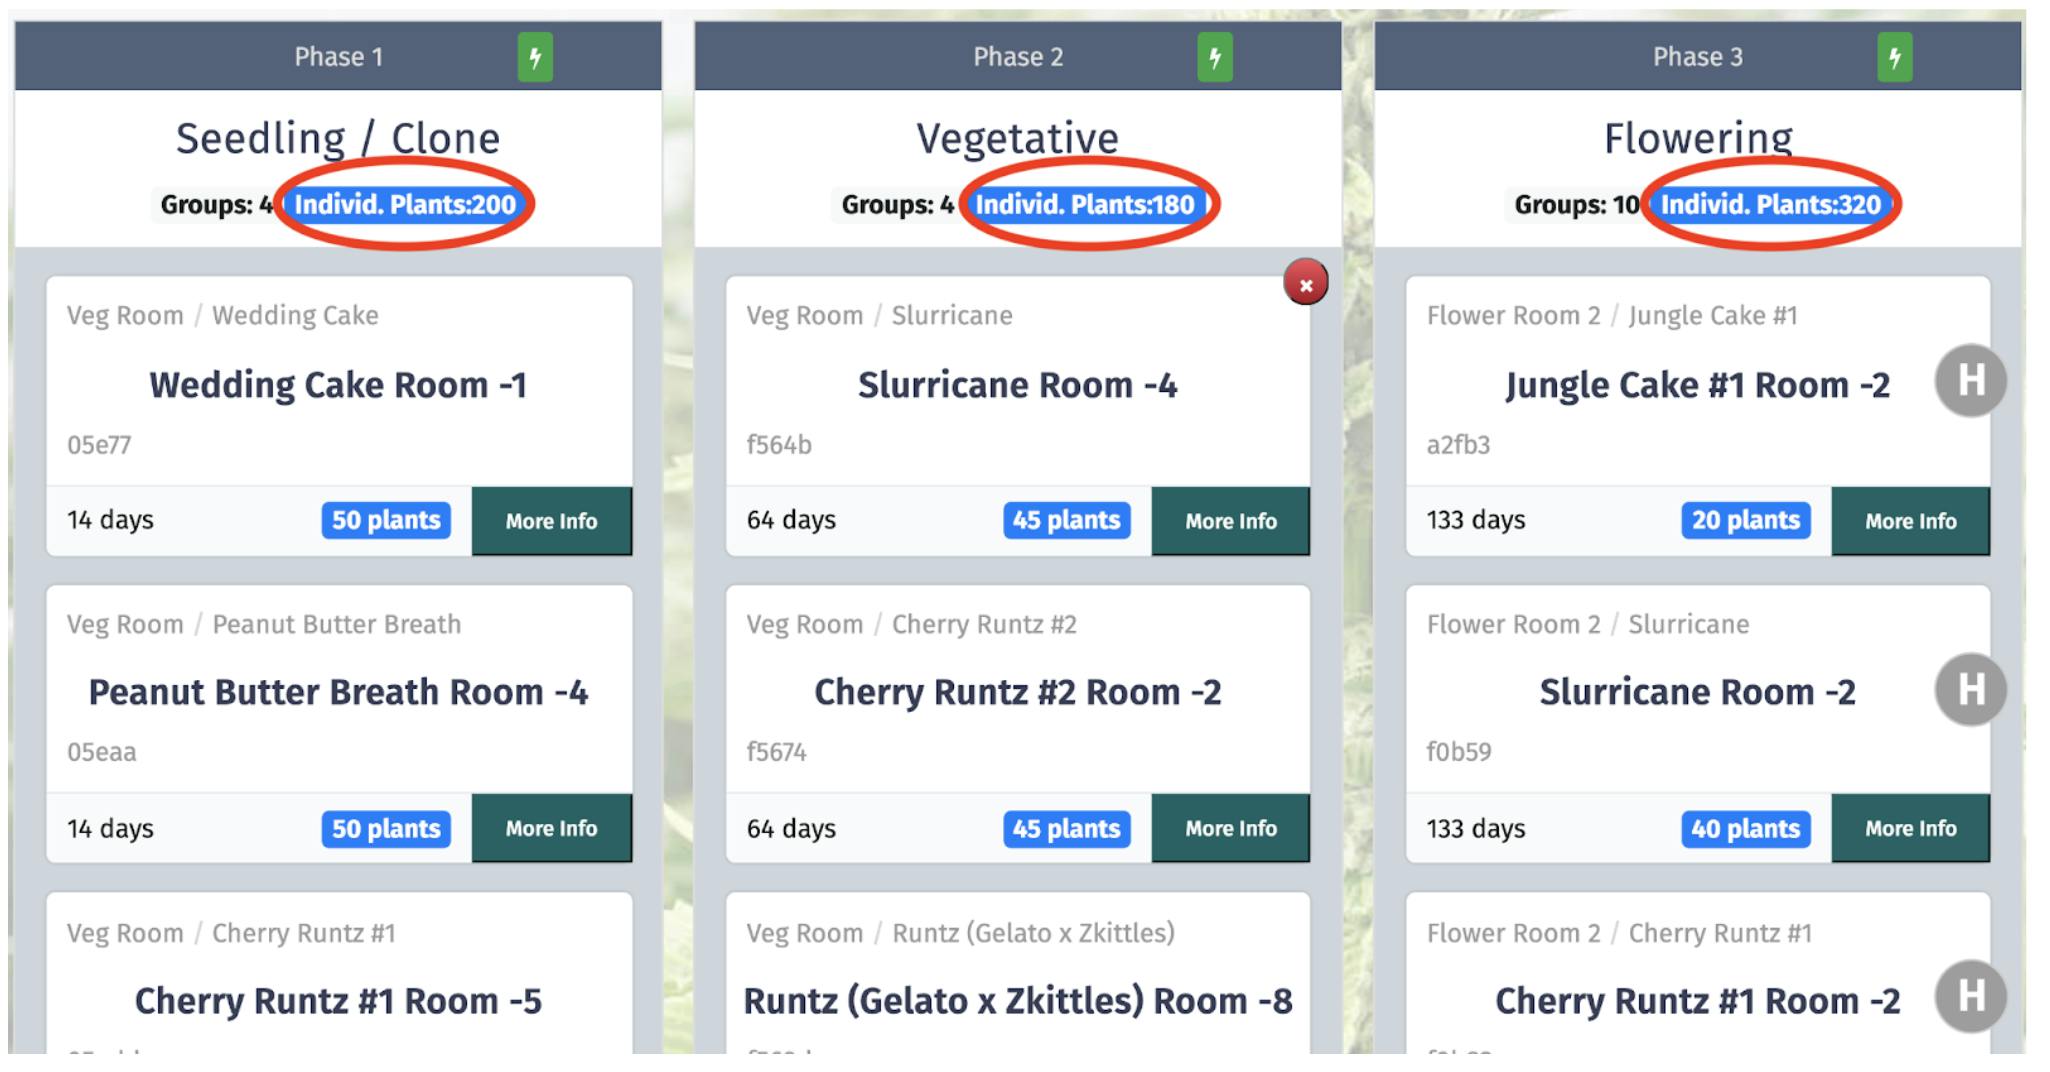
In this example the grower always knows that in order to max out a flower area they need to start with 200 cuts, move 180 cuts to veg, and finally move 160 plants to a flower room. In this scenario you have the opportunity to limit and make data inputs consistent.
- Create or Import Clones 200 Clones
- Destroy or Split 20 Clones
- Move 180 Plants to Vegative Phase
- Destroy or Split 20 Clones
- Move 160 Plants to Flower Phase
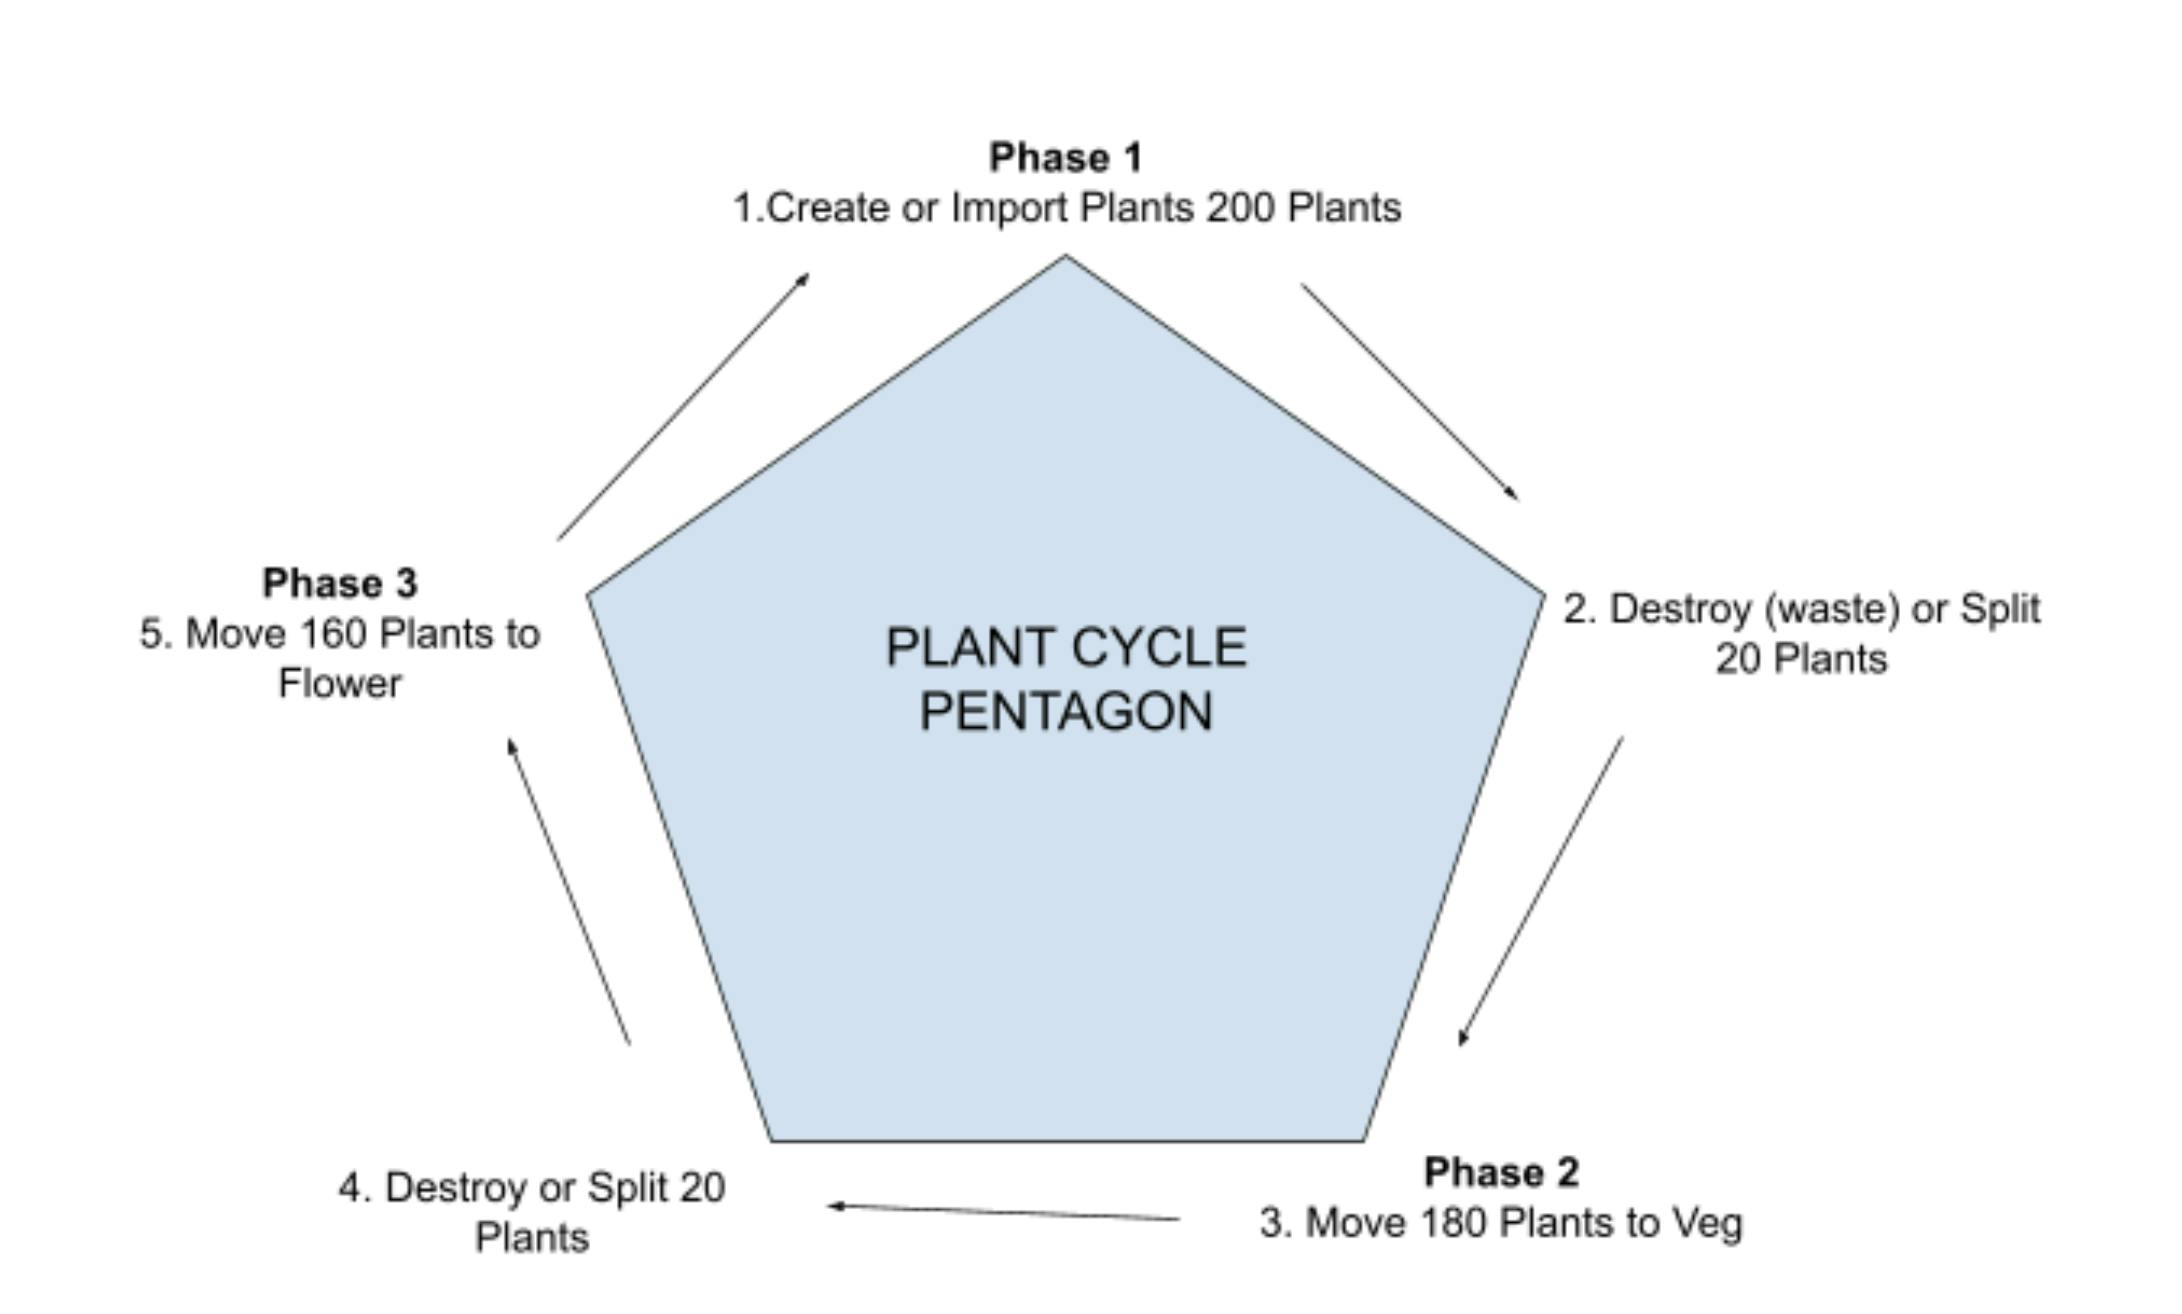
By simplifying the process there are only 3 real actions necessary to move plants through growth cycle (1. Create, 2. Destroy (waste), and 2. Move Phase). Ultimately you are just repeating these actions.
Plant Cohort Creation Timelines
The frequency in which you repeat these actions is based on Harvest Frequency. Harvest is the driving force of movement in your facility. Everytime you harvest we revert back to Step 1. Cohort Creation.
Flowering Weeks / Flowering Zones = Cohort Creation Frequency (CCF)
To reference the earlier example a facility with 2 Flowering Zones with a 9 Week Flower period would have a CCF of 4.5 Weeks or 33.5 days.
9 Weeks Flower / 2 Flowering Zones = 4.5 Weeks or 33.5 Days (CCF)
This means that every 33.5 Days they would be going through the 5 movements on the Plant Cycle Pentagon.
By following this system you know exactly;
- where any given plant is at any given time
- can easily predict what will be your next data input
- reduce the nee for excessive audits in garden
Let us know your thoughts in comments below. Contact GroLens to help create a plan for your garden